by Nicole Lauzon, OCT, Educational Consultant, LDAO
Description
A graphic organizer, also known as a knowledge map, concept map, story map, cognitive organizer, advance organizer, or concept diagram, is a communication tool that uses visual symbols to express knowledge, concepts, thoughts, or ideas. Graphic organizers guide learners’ thinking as they fill in and build upon a visual map or diagram. A graphic organizer allows students to organize their thoughts in an orderly fashion and to demonstrate links between diverse concepts (Bromley, 1996; Bromley, DeVitis and Modlo, 1995).
Graphic organizers are particularly useful in supporting literacy skill development in students with learning disabilities because as visual tools, they reduce the amount of cognitive effort required on the part of the student. In other words, the student doesn’t need to store a large quantity of information in their working memory in order to succeed in understanding a particular idea (Ellis, 2004).
The video below helps to explain what a graphic organizer is and how it can be used in the classroom:
(Source: YouTube)
Curriculum/Developmental Area
All curricular areas; graphic organizers are some of the most effective visual learning strategies for students and are applied across the curriculum to enhance learning and understanding of subject matter or course content.
Grades
Primary, junior, intermediate, senior
Groupings
Different group sizes
Materials/Preparation
White board, bristol boards, construction paper, drawing paper or printer paper, markers, or software (e.g. SmartArt in Microsoft Word)
Steps
How graphic organizers can be used to facilitate student learning (Inspiration Software):
- Helping students structure writing project
- Encouraging students to make decisions
- Making it easy for students to classify ideas and communicate
- Allowing students to examine relationships
- Guiding students in demonstrating their thinking process
- Helping students increase reading comprehension
- Making it easy to brainstorm
- Encouraging students to organize essential concepts and ideas
- Making it clear how to break a story into the main elements
Graphic organizers can take many forms; each type has a specific role in the learning process.
- Relational Organizers:
- Storyboard
- Fishbone
- Cause and effect web
- Category/Classification Organizers:
- Concept mapping
- KWL tables
- Mind mapping
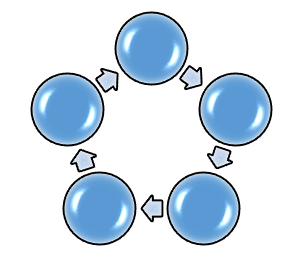
- Sequence Organizers:
- Chain
- Ladder
- Cycle
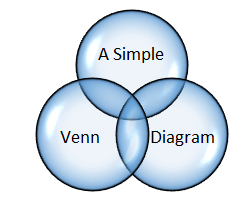
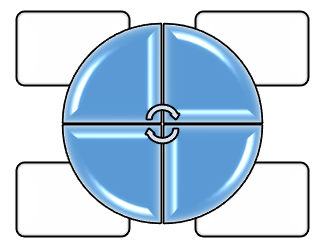
- Compare/Contract Organizers:
- Venn diagrams
- Concept Development Organizers:
- Story web
- Word web
- Circle chart
- Web chart
- Concept trees
The following list of websites provide free printable graphic organizers:
- TeacherVision® offers a collection of ready-to-use, printable graphic organizers for reading, science, writing, math, and for general use. You’ll also find blank printable templates like graph paper, dot arrays, and other useful tools. Click here to access the website.
- Education Oasis offers a variety of categories of graphic organizers, some of which can be filled out electronically. Click here to access the website.
- Enchanted Learning’s website offers a selection of graphic organizers, as well as some tips on how to select an appropriate type of graphic organizer to meet your teaching goals. Click here to access the website.
Adaptations/Extensions
To use graphic organizers during a novel study, the teacher should provide students with a chronological illustration of a series of events; a Venn diagram may be used to illustrate the differences between two different historical periods. This method can benefit all students and help them to better understand content, to establish links with what they already know, and to better illustrate abstract concepts.
A student who has difficulty taking notes may learn how to take better notes through a concept map.
Click here to access a selection of concept map templates that you can download and print.
Cyclical diagrams can be used to illustrate the life cycle of plants and flowers. A teacher can include some of the main points (pollination, seed germination), and students can add in the other stages of the life cycle and provide an illustration, where appropriate.
Assessment/Evaluation
Formal and informal observation, anecdotal records, self-assessment activities, evaluation checklists, performance evaluation, student portfolios, oral questioning and answering, interviews, presentations
References:
Billmeyer, R., Barton, M. L. (1998). Teaching reading in the content areas: If not me, then who? (2nd ed.). Aurora: McREL.
Bromley, K. (1996). Webbing with literature: Creating story maps with children books (2nd ed.). Boston: Allyn & Bacon
Bromley, K., Irwin-De Vitis, L. and Modlo, M. (1995). Graphic Organizers: Visual Strategies for Active Learning. New York, NY: Scholastic Professional Books.
Ellis, E. (2004). Q&A: What’s the big deal with graphic organizers? Retrieved March 28, 2016 from https://mcsold1.monet.k12.ca.us/Academics/el712/Graphic%20Organizers/Q%20and%20A%20about%20G%20O.pdf
Powered by LDAO
LD@school is a signature initiative of the Learning Disabilities Association of Ontario (LDAO), a registered charity and provincial leader in evidence-informed, inclusive, and accessible education.
For over 60 years, LDAO has supported children, youth, and adults with learning disabilities (LDs) and related conditions such as ADHD.
Explore LDAO’s signature platforms:
TA@l’école – French-language resources and professional learning for educators that integrate evidence-informed instruction with equity, identity, and belonging.
LD@home – Family-focused tools and guidance that strengthen partnerships between home and school.
LD@work – Resources supporting transition, self-advocacy, career development, and workplace inclusion.
LD@learning – Online courses and professional learning for individuals supporting learners with LDs and ADHD.